Introduction
For importers, exporters, and logistics managers, ocean freight rates directly determine what it costs to move goods across the world's major trade lanes — and right now, those costs are anything but predictable. Understanding where rates are headed in 2026 is essential to controlling shipping budgets and staying competitive in international markets.
Rates have pulled back sharply from the 2024 peaks — when some lanes saw spot rates surge over 100% — but the market hasn't stabilized. New geopolitical pressures, shifting US trade policies, and tariff uncertainty are creating unpredictable demand patterns.
At the same time, a wave of new vessel capacity entering service is pushing rates down even as Red Sea disruptions continue to inflate transit times and costs on key routes.
For businesses shipping goods internationally, this environment demands close attention to rate trends, strategic contract timing, and flexible carrier relationships.
Key Takeaways
- Spot rates have fallen sharply from 2024 peaks but remain volatile due to tariff uncertainty and geopolitical disruptions
- New vessel capacity is creating oversupply pressure, pushing rates down on major trade lanes
- US tariff policy continues to drive erratic demand—frontloading surges followed by sudden pullbacks
- Red Sea rerouting absorbs ~2.5 million TEU of capacity, keeping rates elevated on Asia-Europe and Asia-US East Coast routes
- Timing shipments carefully and comparing rates across carriers can meaningfully cut costs in this unpredictable market
Key Ocean Freight Rate Trends in 2026
Rate Normalization After the 2024 Surge
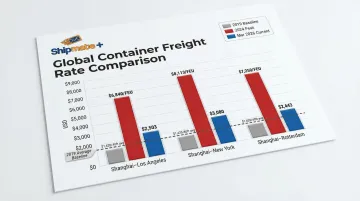
Ocean freight rates have moderated significantly from their 2024 highs. As of March 12, 2026, the Drewry World Container Index (WCI) stood at $2,123 per 40ft container, down sharply from mid-2024 peaks when Asia-US West Coast rates hit $6,840/FEU and Asia-US East Coast rates reached $8,113/FEU.
Key lane rates as of March 2026:
- Shanghai–Rotterdam: $2,443/40ft
- Shanghai–Genoa: $3,120/40ft
- Shanghai–Los Angeles: $2,503/40ft
- Shanghai–New York: $3,080/40ft
While these figures represent substantial declines from 2024, they remain elevated compared to pre-pandemic baselines. The 2019 pre-pandemic average was approximately $1,420 per 40ft container, meaning current rates are still roughly 50% higher than historical norms.
Important caveat: "Normalization" does not mean stability. Rates continue to fluctuate week-to-week based on demand shifts, carrier capacity management, and external disruptions. Shippers should not expect a return to the ultra-low rates seen in 2023 or assume the current environment is predictable.
Tariff-Driven Demand Volatility
US trade tariff policy is now the dominant driver of transpacific rate volatility in 2026. The announcement of 145% tariffs on China in April 2025, followed by a 90-day pause in May 2025, triggered massive waves of frontloading as importers rushed to bring in goods before tariffs took effect.
The National Retail Federation reported that retailers accelerated orders dramatically during the pause window, creating sudden capacity shortages and rate spikes. When the frontloading wave subsided in June 2025, carriers responded by blanking (canceling) sailings—Sea-Intelligence documented that scheduled blanked capacity on the Asia-North America East Coast lane spiked to 42% of total offered capacity for the week starting May 5, 2025.
This pattern of surge-and-pullback continues to create unpredictable rate swings in short windows, making it difficult for shippers to forecast costs or plan inventory builds with confidence.
Geopolitical Disruptions Forcing Longer Routes
Ongoing Red Sea security concerns have forced the majority of carriers to reroute vessels around the Cape of Good Hope, significantly extending transit times and consuming vessel capacity on key Asia-Europe and Asia-US East Coast lanes.
As of January 2026, only 26 containerships were sailing via the Suez Canal compared to 175 via the Cape of Good Hope. That's well below the pre-crisis normal of about 80 weekly Suez transits. Sea-Intelligence calculated that the Asia-Europe supply chain became 7-14 days longer due to Cape of Good Hope diversions. Xeneta notes that these longer sailing distances absorb around 2.5 million TEU of global container shipping capacity—a significant structural drain on available supply.
While some carriers tested a return to the Suez Canal in early 2026, US and Israel military strikes against Iran in late February shattered hopes for a large-scale return to the Red Sea in 2026, forcing carriers to re-divert vessels to prioritize crew safety.
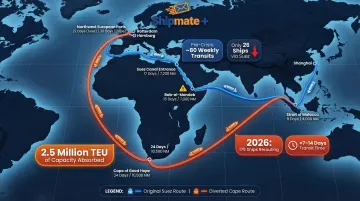
Key takeaway: Red Sea rerouting has become a semi-permanent pricing factor rather than a short-term anomaly. Further escalation or de-escalation of regional conflicts could shift rates rapidly in either direction.
New Vessel Capacity Adding Supply Pressure
A wave of new container ship orders placed during the 2021-2022 boom is now delivering vessels into the market, creating potential oversupply. As of March 2026, the container ship orderbook hit a record high of 11.8 million TEU across more than 1,350 ships, representing 34% of the existing fleet capacity.
This structural overcapacity is a major force distinguishing 2026 from the supply-constrained environment of 2021-2024. When demand growth does not keep pace with fleet expansion, spot rates tend to decline as carriers compete for cargo. Drewry's Financial Health Check noted that the 2026 outlook remains negative, with spot rates forecast to decline further as overcapacity worsens.
Sea-Intelligence projects that cyclical overcapacity will peak in 2027. Downward rate pressure may persist well beyond 2026 unless demand surges or carriers aggressively remove capacity through blanked sailings.
What's Driving Ocean Freight Rate Changes in 2026
Ocean freight rates reflect the intersection of global trade policy, geopolitical events, fuel economics, fleet capacity, and demand cycles all at once. Understanding these drivers helps shippers anticipate rate movements and plan accordingly.
Trade Policy and Tariffs
US-China trade tensions and broader tariff frameworks remain the single most disruptive force on transpacific rates in 2026. Tariff-related frontloading has caused unpredictable demand surges and collapses that carriers and shippers struggle to plan around.
The pattern repeats predictably: importers rush goods in before tariff deadlines, spiking demand and rates; then tariff pauses trigger sharp pullbacks, forcing carriers to blank sailings. This cycle has run multiple times in 2025-2026, producing a volatile pricing environment that disrupts traditional seasonal patterns.
Key dynamics of tariff-driven volatility:
- Sudden capacity shortages when importers front-load ahead of deadlines
- Demand collapses when tariff pauses or extensions are announced
- Blank sailings used by carriers to prevent rate collapse during slow periods
Geopolitical Risk and Route Disruptions
Conflict zones—particularly the Red Sea/Suez Canal corridor—force carriers to add extra sailing days, reducing effective capacity on those trade lanes and pushing rates up. What began as a short-term disruption in late 2023 has become an ongoing pricing factor in 2026.
Rerouting around the Cape of Good Hope has a compounding effect on available supply:
- Consumes more vessel capacity per voyage
- Requires significantly more fuel
- Ties up ships for additional weeks, shrinking effective fleet availability
The result is upward rate pressure on Asia-Europe and Asia-US East Coast lanes, even as the total fleet size grows.
Fleet Capacity and Carrier Alliances
Major carrier alliances influence capacity management through coordinated scheduling and blank sailings. The alliance landscape restructured in early 2025 with the launch of the Gemini Cooperation (Maersk and Hapag-Lloyd) and the Premier Alliance (HMM, ONE, Yang Ming).
Carriers can blank (cancel) sailings to support rates even when demand softens. To manage post-Lunar New Year demand softening in 2026, carriers announced 125 blank sailings (18% of scheduled departures) for weeks 7-11. This capacity discipline prevents rates from falling too quickly during soft demand periods.
Bunker Fuel Costs and Environmental Regulations
IMO 2020 sulfur rules and the push toward green shipping fuels continue to add cost layers to base rates through Bunker Adjustment Factors (BAF). In early March 2026, global bunker prices surged 30-35% due to the US-Iran conflict, with Singapore VLSFO reaching $1,120.50/mt.
Carriers responded by implementing Emergency Fuel Surcharges (EFS):
- CMA CGM: $150/TEU effective March 16, 2026
- Hapag-Lloyd: $160/TEU effective March 23, 2026
The shift to LNG, methanol, and other low-emission fuels adds a structural cost layer on top of volatile spot fuel prices. The IMO's Carbon Intensity Indicator (CII) and Energy Efficiency Existing Ship Index (EEXI) require measurable efficiency gains, and carriers pass compliance costs directly through to shippers.
Seasonal Demand Patterns
Predictable seasonal factors still create recurring rate spikes even within an otherwise softening market:
- Pre-Lunar New Year inventory builds (January-February): Importers stock up before Chinese factories close
- Summer peak season (June-August): Retailers prepare for holiday season inventory
- Post-holiday softness (January-February): Demand drops after peak season ends
In 2026, tariff-driven frontloading has disrupted these traditional patterns, but seasonal cycles remain a baseline influence on rate movements.
How Ocean Freight Rates Are Calculated
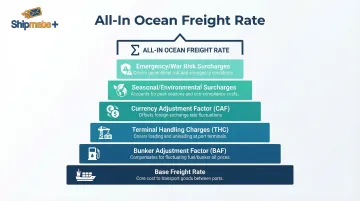
Understanding how ocean freight rates are structured helps shippers evaluate quotes and identify cost-saving opportunities. Rates are composed of multiple elements beyond just the base freight charge.
Key Rate Components
Base freight rate: The core charge for transporting your container from origin port to destination port, quoted per container (FCL) or per cubic meter/kg (LCL).
Bunker Adjustment Factor (BAF): A surcharge based on TEU to smooth out the effect of oil price fluctuations on carrier fuel costs. As fuel prices rise or fall, BAF adjusts accordingly.
Terminal Handling Charges (THC): Costs associated with the terminal provider's services at origin and destination ports, covering access, equipment, and labor (stevedoring).
Currency Adjustment Factor (CAF): A surcharge based on TEU that accounts for currency fluctuations to stabilize main leg costs when exchange rates shift.
Additional surcharges:
- Peak Season Surcharge (PSS) during high-demand periods
- EU ETS surcharge for environmental compliance
- Port congestion surcharges when terminals experience delays
- War Risk Surcharge when vessels transit designated war risk zones
- Emergency Fuel Surcharge (EFS) during sudden fuel price spikes
FCL vs. LCL Pricing
FCL (Full Container Load): You book an entire container exclusively for your cargo. Rates are quoted per container (20ft, 40ft, or 40ft High Cube). FCL generally offers better per-unit rates and faster transit for shipments over approximately 15 cubic meters — at that volume, the per-unit savings typically outweigh the cost of booking a full box.
LCL (Less than Container Load): Your cargo shares a container with other shippers' goods. Rates are quoted primarily by volume in cubic meters (CBM), or by weight if the cargo is exceptionally heavy. LCL is cost-effective for smaller shipments but involves longer transit times due to consolidation and deconsolidation at origin and destination.
Benchmarking and Rate Transparency
Once you understand how rates are structured, comparing quotes becomes much more straightforward. These publicly available indexes give you a reliable baseline:
- Drewry World Container Index (WCI)
- Freightos Baltic Index (FBX)
- Xeneta Shipping Index (XSI)
For smaller businesses navigating these rate structures, working with a multi-carrier shipping partner can simplify the process. ShipMate+ in Vista, CA works with FedEx, UPS, USPS, and freight carriers to help customers find the right shipping option for their cargo size and budget. Reach them at (760) 295-1074 or info@shipmateplus.com.
How These Rate Trends Are Impacting Shippers
Operational Impact
Rate volatility is making inventory planning harder for businesses that relied on predictable shipping costs. Companies are being forced to:
- Build larger cost buffers into pricing models to absorb rate swings
- Accept longer lead times due to Red Sea rerouting (7-14 additional days on Asia-Europe lanes)
- Pay premium spot rates when demand surges unexpectedly
- Increase safety stock levels to protect against transit delays
The 2025 State of Logistics Report by Kearney highlighted that new tariffs and trade policy uncertainty raised compliance costs, prompting companies to diversify supply chains and invest in tariff-tracking tools to manage risk.
Financial and Business Impact
Fluctuating ocean freight costs are squeezing margins, especially for e-commerce businesses and importers with fixed retail pricing. When freight rates spike unexpectedly, companies face difficult choices:
- Absorb the cost increase and accept lower margins
- Pass costs to customers and risk losing price-sensitive buyers
- Delay shipments and risk stockouts
Those difficult trade-offs are pushing businesses to rethink where they source. The Kearney report found that geopolitical tensions and shifting trade policies are driving supplier diversification and production moves away from China toward Southeast Asia. Nearshoring to Mexico is gaining traction as a way to shorten lead times and reduce exposure to transoceanic rate swings.
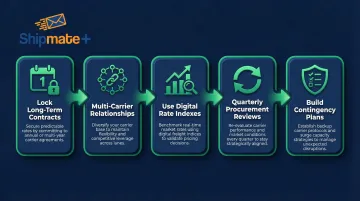
Strategic Response
Shippers are adapting to the volatile environment through a few practical moves:
- Lock in long-term rate contracts during soft market windows — such as post-peak season — before rates climb again
- Maintain relationships with multiple carriers to avoid over-reliance on a single alliance or service string
- Use digital rate indexes for real-time transparency, enabling faster responses to market movements
- Review freight procurement quarterly or monthly (rather than annually) to capture favorable rate windows
- Build contingency plans for both spike and decline scenarios, so pivots happen faster when conditions shift
What to Expect: Ocean Freight Rate Outlook Through Late 2026 and Beyond
The trajectory of ocean freight rates through the remainder of 2026 will depend heavily on three variables: whether US trade policy stabilizes or introduces new tariff disruptions, whether Red Sea security conditions improve enough for carriers to resume Suez Canal routing, and how quickly new vessel capacity gets absorbed by demand growth.
Two Most Likely Scenarios
Scenario 1: Continued Soft-to-Moderate Rate Environment
If capacity oversupply persists and tariff tensions ease, rates will likely continue their downward trajectory from 2024 peaks. Xeneta's 2026 Ocean Outlook sets expectations for lower long-term and short-term rates as overcapacity continues to weigh on carriers.
The numbers support this: the global container fleet is expected to grow 3.6% against demand growth of just 3%. Drewry similarly forecasts that spot rates will decline further as the supply gap widens.
In this scenario, shippers benefit from competitive pricing and should focus on locking in favorable long-term contracts while rates remain soft.
Scenario 2: Sharp Rate Spike from New Disruption
If a new geopolitical event disrupts routing or another wave of tariff frontloading floods the market, rates could spike sharply and quickly. Freightos notes that even a resumption of Suez Canal traffic will initially create congestion and upward rate pressure as shipping patterns readjust.
Any escalation in Middle East conflicts or new US-China tariff announcements could trigger immediate capacity shortages and rate surges on top of that.
In this scenario, shippers with locked-in contracts will be protected, while those relying on spot markets will face sudden cost increases.
Building Contingency Plans
Shippers and businesses that invest in rate monitoring and maintain flexible carrier relationships will be best positioned to manage unexpected cost swings in 2026 and into 2027. Treating ocean freight procurement as an ongoing strategic activity — not a once-a-year task — is what separates prepared shippers from reactive ones.
Recommended actions:
- Monitor rate indexes weekly (Drewry WCI, Freightos FBX, Xeneta XSI)
- Maintain relationships with multiple carriers across different alliances
- Review contracts quarterly and be ready to renegotiate when favorable windows open
- Build scenario-based cost models for both rate spike and rate decline scenarios
- Diversify sourcing and routing options to reduce dependency on single trade lanes
Frequently Asked Questions
What are ocean freight rates?
Ocean freight rates are the prices charged by carriers to transport goods by sea between international ports, typically quoted per container (FCL) or per cubic meter/kg (LCL). They fluctuate based on supply, demand, fuel costs, geopolitical events, and market conditions.
How to calculate sea freight cost?
Sea freight cost combines the base rate (per container or per CBM/kg) with surcharges — Bunker Adjustment Factor (BAF), Terminal Handling Charges (THC), Currency Adjustment Factor (CAF), plus any peak season, congestion, or war risk fees. Final cost varies by shipment size and trade lane.
How much is ocean freight per kg?
Ocean freight per kg varies significantly by route and shipment size, but major routes like China to the US typically range from approximately $2–$4 per kg for LCL shipments. Verify current rates using a live freight index or contact a freight specialist for accurate quotes.
What is the difference between FCL and LCL shipping?
FCL books an entire container for your cargo alone; LCL shares container space with other shippers. FCL typically offers better per-unit rates and faster transit once your shipment exceeds roughly 15 cubic meters.
What is causing ocean freight rate volatility in 2026?
Several overlapping factors are driving volatility in 2026:
- US tariff policy triggering demand surges and sudden pullbacks
- Red Sea rerouting cutting effective vessel capacity on key lanes
- New ship deliveries adding oversupply pressure
- Seasonal demand cycles amplifying swings in both directions
When is the cheapest time to ship ocean freight?
Rates tend to be lower in the weeks immediately after major peak seasons (post-Chinese New Year in February and post-holiday season in January). However, in 2026 tariff-driven frontloading has disrupted traditional seasonal patterns. Monitoring rate indexes regularly helps identify favorable booking windows.